New data projects more than 176,000 West Tennessee residents by 2045

By KATE COIL
TML Communications Specialist
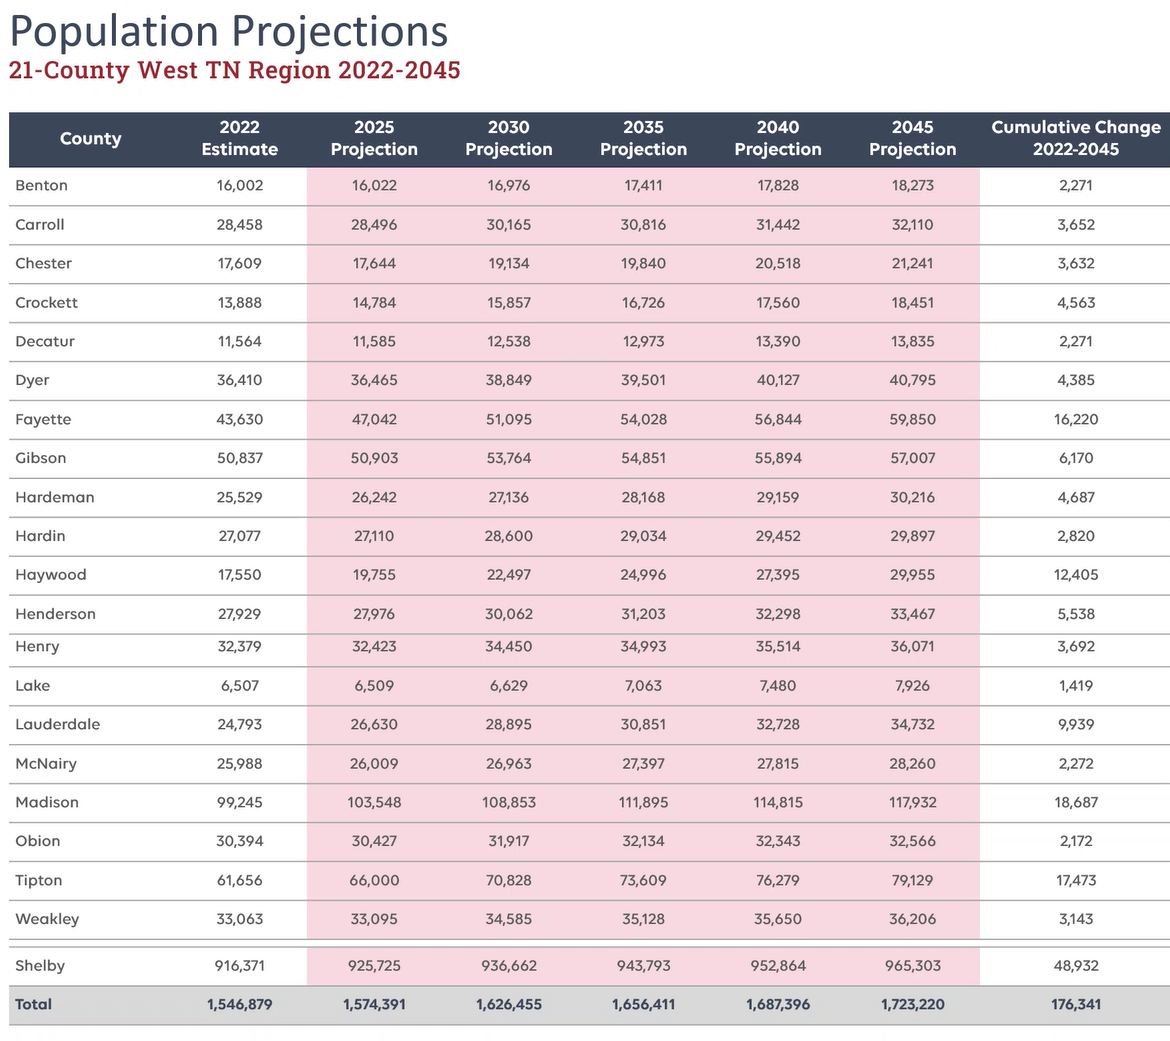
New population projects indicate that Blue Oval City could bring more than 176,000 new residents to West Tennessee by 2045 with population growth increasing in all 21 counties.
Sharon Younger, founder of economic research and strategic communications firm Younger & Associates, presented the group’s population projects at a recent Blue Oval Community Impact meeting hosted by the Tennessee Department of Economic and Community Development (TNECD).
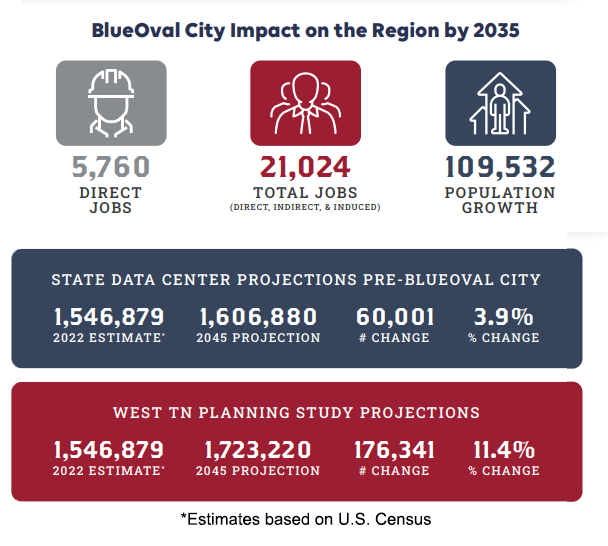
The firm predicted a “moderately aggressive” growth rate of 11.4% on average across West Tennessee from 2022 to 2045, approximately 176,341 new residents bringing the total West Tennessee Population to 1,723,220. Younger noted that these numbers should be used by communities to help plan how many future residents they need to be prepared to serve.
“I would like to say the population estimates we put before you are moderately aggressive; they are not conservative and they are not over-the-top aggressive,” Younger said. “It does make the presumption that our communities will make substantial investments in infrastructure and public services. Without these two investments, these numbers most likely would not be achieved. We are seeing there is a path forward to do that. The other assumption is there are large tracts of lands that will be put into development that haven't previously put into development. West Tennessee has some massive agricultural operations as well as some land that has been left fallow. It is going to require putting those tracts into development and getting infrastructure to those tracts.”
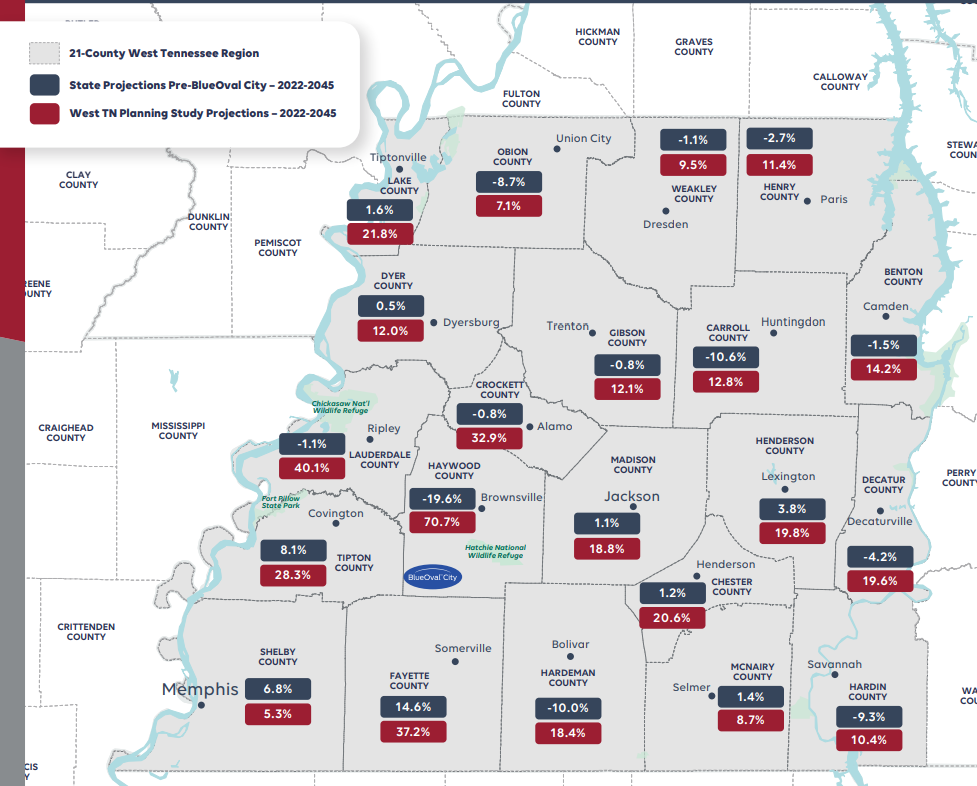
Prior to Younger & Associates’ findings, the most recent numbers on West Tennessee population projections from the State Data Center at UT’s Boyd Center had been made prior to the Blue Oval announcement. Pre-Blue Oval, the State Data Center had projected a 3.9% change in West Tennessee’s population with 60,001 new residents by 2045. Younger said these numbers were used by her firm as a starting point.
“We know that prior to the announcement of Blue Oval City, the majority of our rural counties have experienced declining populations,” Younger said. “Population trends from the past few decades projected out through the future was a declining population, not that it is a negative reflection on West Tennessee in anyway. If you look nationally, the population for rural communities was projected to decline and that was projected to continue for some period of time. We are looking at a total reversal of those populations moving ahead.”
Haywood County, where the Blue Oval facility itself is located, is expecting the largest population growth at 70.7% between 2022 and 2045. Lauderdale County is projected to have the second highest growth rate of 40.1% followed by Fayette County with 37.2%. Younger said growth is projected in all 21 counties.
“The two metro areas – the Jackson metro and the Memphis metro – did not have declining numbers, again reflecting national trends,” she said. “What we were seeing in Jackson and Memphis was that the growth rate was slower than the national average and the Tennessee average, which has been pushed above the national average by growth rates in places like Nashville. Another important factor looking at these population projects is that we have been experiencing what economists call full employment, which means we have unemployment rates under 4%. In order for companies to hire someone, they have to find someone to hire. The need for jobs is going to put upward pressure on population as we bring these new jobs in.”
While the Younger & Associates projections generally trended higher than the State Data Center’s pre-Blue Oval predictions, the Younger projection for Shelby County is a 5.3% population increase, down from the State Data Center’s 6.8%.
“The projections for Shelby County are lower than what they were pre-Blue Oval is because our projection goes out through 2045,” she said. “That has a dampening effect. We have Shelby County growing more than the state projected in the early years. We then dropped back to the state projection for them in the later years. It’s really an anomaly that it looks lower. Essentially what we looked at is that Shelby County has not been growing as Nashville or even as much as the state average. Our assumption is that Shelby County would go to those averages in the immediate future.”
Younger said Shelby County was held out of the projections of the remaining 20 counties in the region because it faces other factors those areas do not.
“It makes up such a large percentage of not just the population but of the GDP of the region,” she said. “There are many factors different in a Shelby County economy than a rural West Tennessee economy. Rather than lump it all together, we held it separately so we could apply different assumptions and hopefully come up with a better outcome for every county involved.”
Younger said there will be two layers of population growth. The first is the estimated direct and indirect jobs created by Blue Oval, SK, and their suppliers. The second layer of growth is “organic growth” that can occur in each community. Younger predicts a total of 21,024 jobs created not just by Blue Oval and related suppliers but also created as a result of the economic growth those jobs will create.
“As we develop in each community better infrastructure, more public services, improve our school systems, invest in amenities that are attractive to people not only will the direct and indirect jobs move into West Tennessee but West Tennessee becomes more attractive in general,” she said. “As we see population growth in West Tennessee, that population growth approximates the level of growth Tennessee as a state has enjoyed for years. Tennessee has been one of the fastest growing states in the U.S., but West Tennessee has not grown at that same rate. We are projected West Tennessee to be growing at that same rate by 2030 or 2040.”
To arrive at their projections, Younger said researchers looked at a variety of factors including location, the ability to attract Ford suppliers, available housing, public school quality, amenity density, and current population trends. Initially, Younger said population increases will follow the path of least resistance where it is presently easiest to settle in.
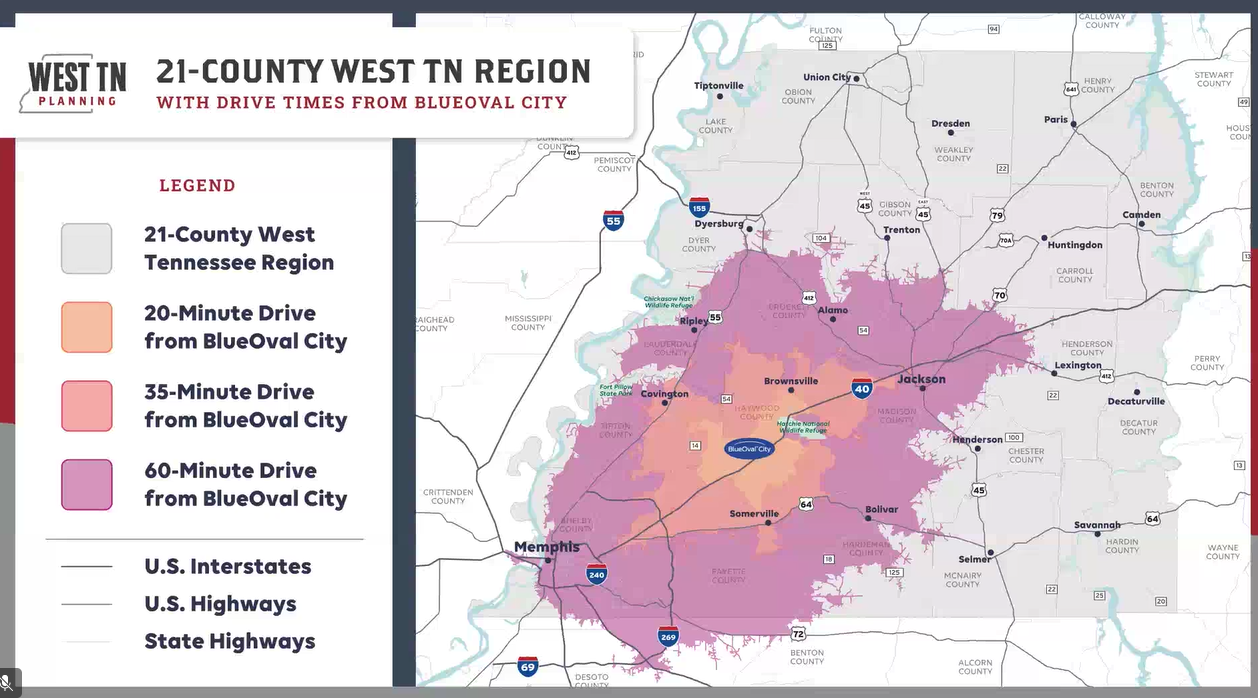
“Blue Oval is coming on so fast that people will have to go where there is available housing,” she said. “The housing that is available immediately may not be in counties adjacent to Blue Oval. People will initially move further then the population will move out of those areas they initially land and then closer to the Blue Oval area. We expect those eastern suburbs of Shelby County will absorb a lot of that growth initially, but over time that growth will gravitate toward the Blue Oval site as people find their preferred place to live and housing becomes available.”
Where people may choose to move relies on a variety of factors.
“Travel time is a big one,” she said. “Most people want to live within 20 minutes of where they will work. We know with Blue Oval City – at least initially – that will not be possible because of where housing is available. Over time, people want to be within 20 minutes, and you will see that all over the U.S. Conditions of the highways and travel times are important.”
Communities with available certified sites ready for the relocation of Blue Oval suppliers as well as an area’s history of business and job attraction may also indicate where jobs and thereby population will begin to flow.
“All the research done prior to the pandemic on housing found where people move relies on three factors,” Younger said. “The first is where people can find available housing they can afford based on their salary. The second and almost as important a factor is the quality of the public school systems in the area where they were looking. The third is the availability of high-speed broadband. We know Tennessee has been working diligently to solve the broadband issues.”
Amenities a community offers can also make it more attractive.
“We are looking at which counties pull in retail from outside their own borders and already have the amenities that bring people in to shop and find entertainment,” she said. “We looked at where there is unmet demand and potential for growth. We also looked for a primary campus of a four-year university. While nationally most rural areas have seen populations decline, one of the few factors that went against that is a rural community with a four-year university as did waterfront property.”
These factors were then put into a scoring matrix that helped determine where and how growth is expected to happen. She said they also took into account how changes to infrastructure and public services could impact population.
“We used one scoring matrix for the years 2025 through 2030 and a different for the remaining years through 2045,” Younger said. “For instances, say a county didn’t score high initially on quality of public schools. From 2030 on, that county would have had time to invest and make changes to become much more attractive. The road system will change. Where you are located will not change, but the ability to drive to it might. Investment in infrastructure and public amenities will change. Scoring was much further apart initially and much closer together in the later years.”
To view individual area data or learn more in depth information about Younger & Associates’ projections, visit this link.