TSDC: Tennessee's biggest growth story may be in Cookeville
Story by Tennessee State Data Center
A familiar set of counties held the top ten despite some reshuffling, but the more interesting story might be at No. 11.
Davidson County posted Tennessee’s largest population gain in 2025, according to newly released U.S. Census Bureau estimates. The Middle Tennessee county grew by 9,821 people over the year from July 1, 2024, to July 1, 2025 – a 1.3% increase.
Neighboring Middle Tennessee counties Rutherford and Wilson ranked second and third, adding 6,266 and 4,693 residents, respectively. Williamson (No. 7) and Sumner (No. 9) also appeared on this year’s list, underscoring the continued strength of Nashville’s suburban growth.
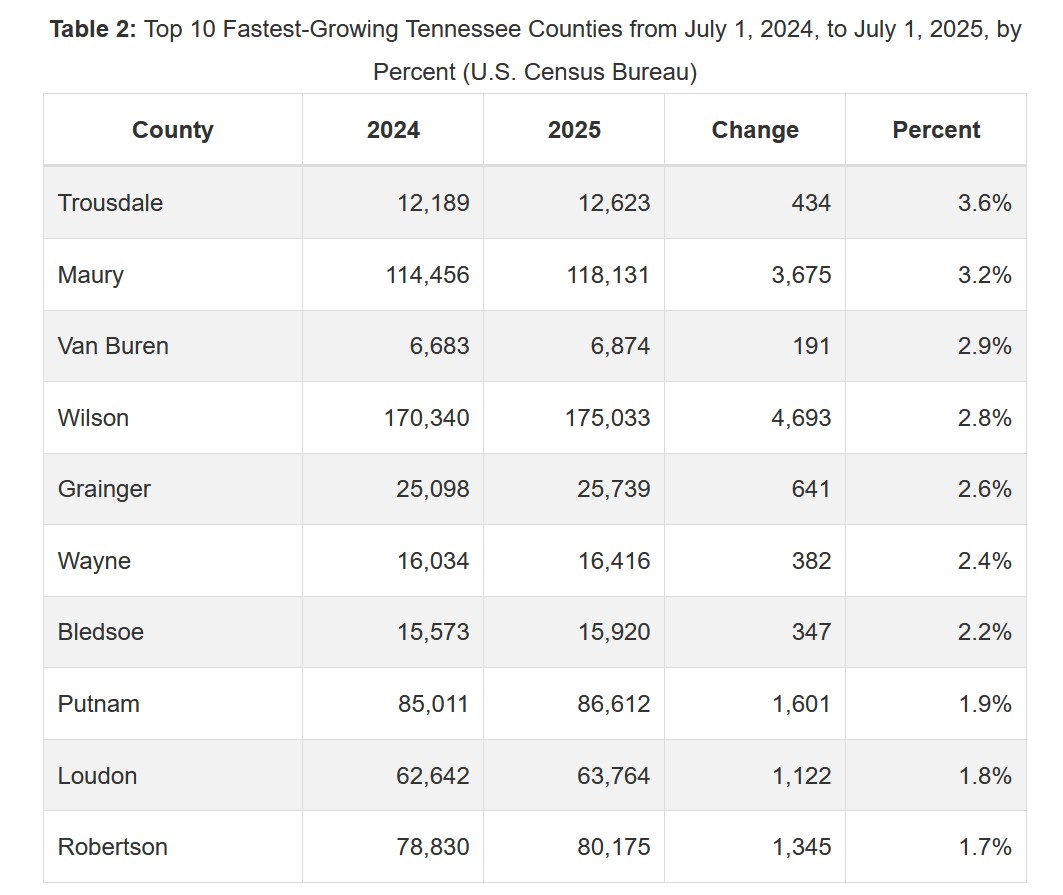
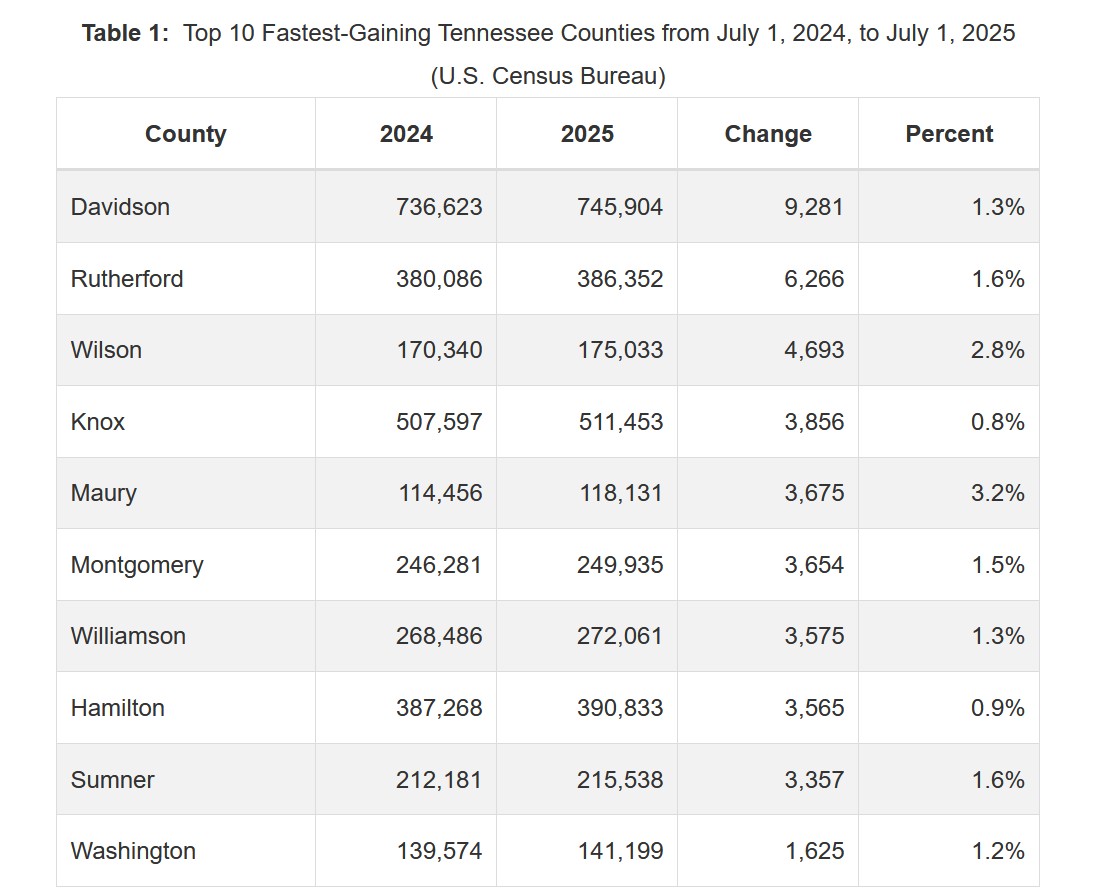 Overall, the top 10 looked much like last year, with only minor reshuffling in rank – except for Washington County in Northeast Tennessee, which returned to the top 10 for the first time since 2022. It took the No. 10 spot, replacing Loudon County. That change was partly due to Washington County’s annual growth rate, which ticked up from 0.8% in 2024 to 1.2% in 2025. Maury County was the only other top-10 county to accelerate in 2025, posting 3.2% growth, up slightly from 3.1% in 2024.
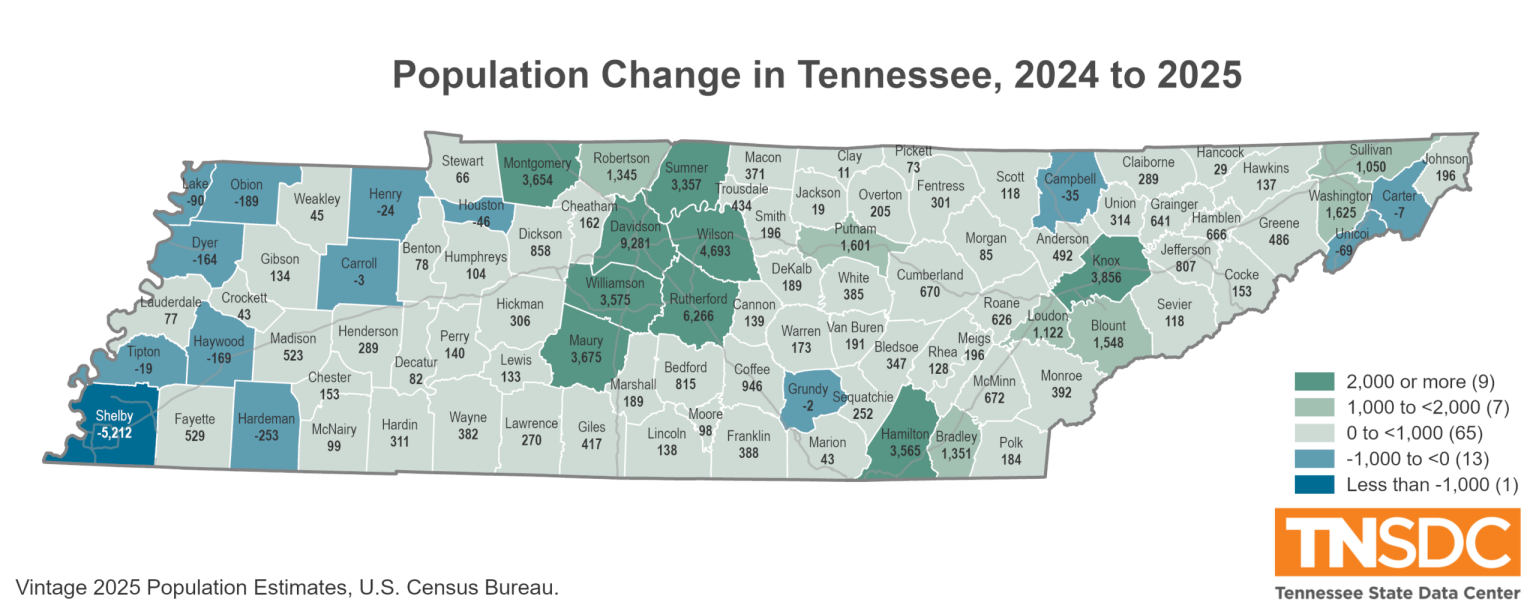
 Tennessee is coming off a record single-year population increase of more than 98,200 residents in 2024. Still, the state added 63,785 residents in 2025 and growth remained widespread, especially across the eastern two-thirds of the state. Of Tennessee’s 95 counties, 81 gained population, but about two-thirds of those counties grew at a slower rate than the year before.
That echoes a national trend in which nearly 8 in 10 counties that gained residents in 2024 posted slower growth or losses in 2025. Declines in international migration were the primary driver of that slowdown.
WE SEE YOU PUTNAM COUNTY
Counties in Middle Tennessee and the state’s other large metros, including Knox (Knoxville), Hamilton (Chattanooga), and Montgomery (Clarksville), largely cover the top 10. But just outside that group stands rural Putnam County at No. 11. Bisected by I-40 and located midway between Nashville and Knoxville, its county seat, Cookeville, is home to Tennessee Tech University.
The county’s population gains have been strong and steady so far this decade, averaging a 1.6% annual growth rate that nets roughly 1,300 additional residents per year. Its 2025 population addition of 1,601 was the largest increase since 2006 when it saw 1,700 new residents. Last year’s gain was notable in its own right because it was one of about a dozen Tennessee counties that posted their largest increase of the decade in 2025.
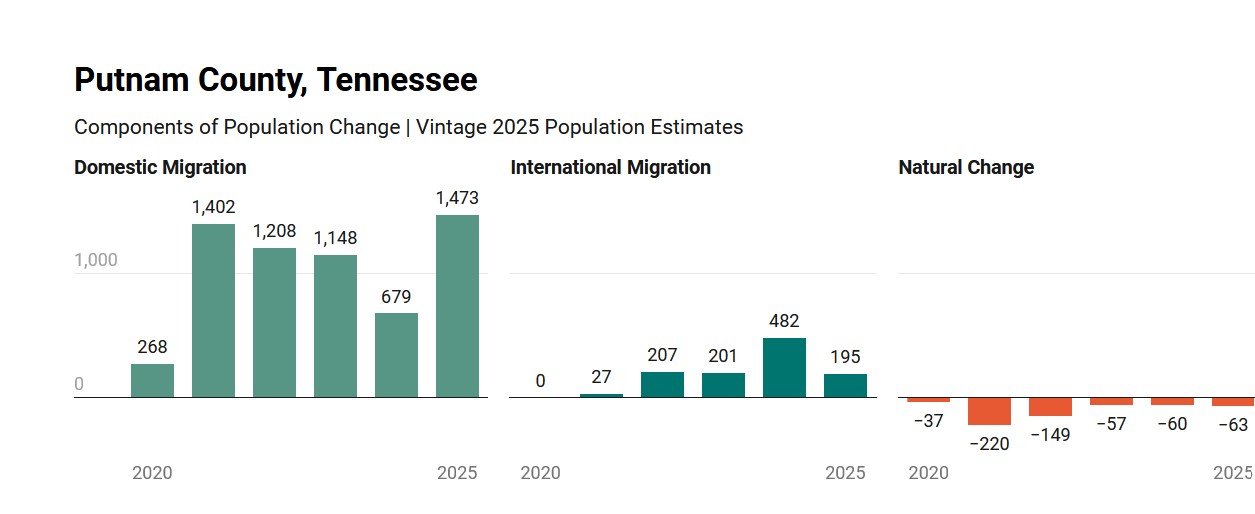
The population increases in Putnam County have been primarily driven by net domestic migration – the difference between inbound and outbound moves among U.S. counties. This year’s 1,473-person increase in the component was also its largest this decade.
But it was a different top 10 list that brought the spotlight to the Upper Cumberland in 2025.
Putnam County is also the core of the four-county Cookeville micropolitan area, which includes Jackson, Overton, and White counties. This statistical area ranked fourth nationwide for numeric growth among all U.S. micropolitan areas in 2025. Micropolitan areas are built around a core city of under 50,000 people and the surrounding counties that are economically tied to that core, often through commuting.
More than a local story, these increases highlight an important, broader trend: the state’s 78 rural counties have matched or outpaced the growth rate of its 17 urban counties every year this decade. Growth in rural counties like Maury, Putnam, Bedford and Coffee is occurring well beyond the suburban edge, bringing attention to the affordability and quality-of-life factors that might be behind it.
MIGRATION LEVELS SETTLE TO TREND
A total of 81 Tennessee counties gained population in 2025, down from 85 in 2024 and the fewest since 2022, when 80 of the state’s 95 counties added residents. Still, that remains above pre-pandemic levels, when roughly 75 counties posted annual gains.
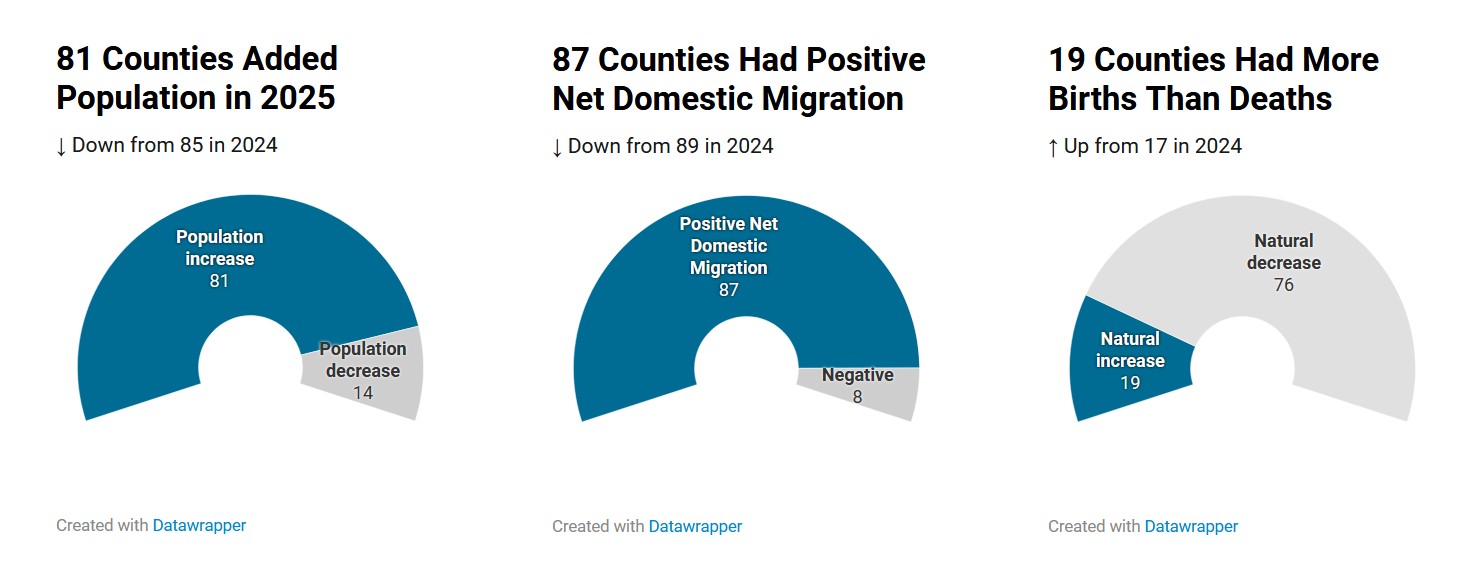
Net domestic migration remains the predominant driver of Tennessee’s population growth, and it’s remarkably widespread—87 of the state’s 95 counties gained more domestic movers than they lost in 2025. The counties that didn’t were mainly confined to the western third of the state, with Shelby County posting the largest net loss from this component at 11,670 people. Montgomery County was the only county in Tennessee where natural increase (more births than deaths) was the prevailing source of population change in 2025.
But while the pattern holds, the pace has cooled. After the red-hot domestic migration numbers of 2022 and 2023, the state appears to be settling back towards pre-pandemic norms. The last 2 years have averaged about 44,400 net domestic movers—not far from the 42,400 annual average in the final 4 years of the prior decade.
To an even larger degree, this may also be true for the elevated levels of net international migration, which reached record highs in 2024 for both Tennessee and the nation. But 2025 saw Tennessee’s figures fall 62%, and the new estimate release shows how this change played out at the county level.
Last year, all 95 counties in Tennessee had international migration totals that were the same as or smaller than in 2024. Nowhere was that more true than in Davidson County, where levels fell by over 8,200 people in 2025. Shelby County numbers were down by more than 6,000 people over the year.
In 2025, 36 Tennessee counties saw net international migration turn negative, up from just 6 in 2024 when the state’s totals were at a record high. While the nation’s net international migration is expected to fall even further in 2026, the question is where it settles. Before the pandemic, Tennessee’s net international migration averaged more than 9,000 people per year. It fell to roughly 4,000 annually from 2019 to 2021 before surging to those record highs in 2024. Where levels ultimately land within that range – or below it – will determine how many more counties are affected, and in some cases, whether the pullback tips more parts of the state into population loss.