NLC report highlights municipal infrastructure priorities as budgets tighten
By KATE COIL
TT&C Assistant Editor
With tightening local budgets and less state and federal grant money expected, municipalities across the country are changing how they prioritize and fund essential infrastructure projects.

The National League of Cities (NLC) has released their 2025 Municipal Infrastructure Conditions report, emphasizing the infrastructure barriers cities are facing and their strategies to overcome them.
NLC CEO and Executive Director Clarence Anthony said the report highlights how municipalities have adapted and been resourceful to address a changing landscape of infrastructure needs, often having to modernize infrastructure while tackling complex socioeconomic and environmental issues and regulations.
“The data reveals a dynamic interplay between the financial and procedural hurdles faced by municipalities and the innovative approaches employed to overcome them,” Anthony said. “Rising costs, regulatory complexities and workforce shortages stand among the chief obstacles, but cities are meeting these matters head-on with various funding solutions, such as borrowing from the market and tapping into local budgets and strategic planning.”
Anthony noted the economic and policy landscapes had already begun to shift as data was collected in the early part of 2025.
“Given federal developments and evolving fiscal conditions, cities remain focused on their core infrastructure priorities, demonstrating remarkable resilience in the face of uncertainty,” he said. “Their ongoing commitment to forward-thinking strategies shows their ability to navigate challenges while delivering essential services to communities.”
SETTING PRIORITIES
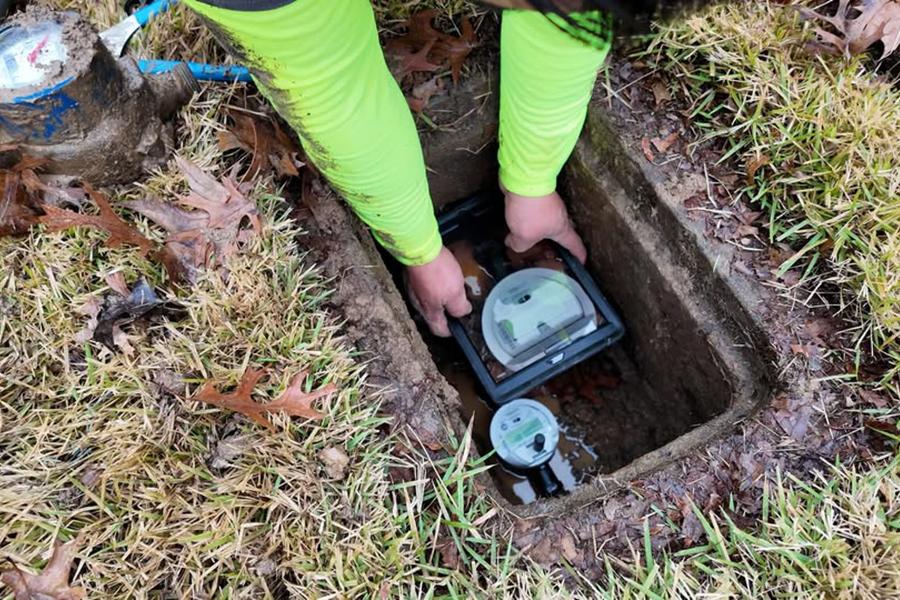
The NLC survey found that water, wastewater, and stormwater systems are the top priorities for municipalities (71%); followed by road and bridge repairs (63%); and sidewalk, trails, and bike infrastructure coming in third (46%). Other categories of priority included energy projects (28%), internet and broadband digital infrastructure (23%), and public transit (15%).

“Notably, water systems and transportation emerged as major concerns when municipalities evaluated the infrastructure required to support housing production,” the study indicated. “This underscores the interconnected nature of infrastructure planning, where essential services such as water access and mobility play a critical role in housing development and community sustainability.”
Researchers said that transit was also seen as a higher priority when categorized alongside projects like roads, bridges, sidewalks, trails, and bike infrastructure but that many cities did not prioritize these projects because those transportation assets are often owned and managed by other levels of government.
Wade Morrell, CEO and executive director of the Tennessee Municipal Bond Fund (TMBF) said he often sees similar priorities in the projects local governments are seeking to finance through TMBF.
“This is mostly true for municipalities if we assume that the sidewalk/trail/bike infrastructure includes parks,” Morrell said. “If those types of projects are exclusively multi-modal transportation infrastructure, then Tennessee will have fewer of those types. TMBF finances several public safety projects annually, such as police and fire stations and their vehicles. Tennessee counties almost exclusively borrow money for schools, jails, road and bridge improvements, and equipment for those types of projects.”

In the past decade, Morrell said TMBF has closed approximately 450 loans valued at more than $1.1 billion.
“Nearly 20% of TMBF’s loans have been for public safety projects,” he said. “Water and wastewater projects were a close second. Road improvements accounted for approximately 10%. The recent infrastructure report from the Tennessee Advisory Commission on Intergovernmental Relations (TACIR) identified more than $77 billion in needed projects over a 5-year period beginning July 2023. Transportation; utilities; education; and health, safety, and welfare projects comprise the largest cost.”
Many officials cited in the NLC report said difficulties in securing funding and the complex nature of planning are reasons why public transit, broadband, and sidewalk or bike infrastructure projects are not higher priorities.
In contrast, the need to modernize aging systems (78%), build economic opportunities (49%), and advance long-term strategic plans (47%) were among the top reasons why municipal officials picked water and road infrastructure as more of a priority. Additionally, 41% of respondents referenced community resilience and disaster preparedness as an urgent concern.
Further breaking down economic reasons for prioritizing projects, leaders said stimulating local business growth and job creation (88%), promoting equitable economic opportunities (65%), and encouraging mixed-use development (54%) were top goals.
OVERCOMING CHALLENGES
Funding was among the biggest hurdle to completing projects with municipal officials citing rising costs of project materials and labor (89%), insufficient capital budgets (84%), inadequate grant or loan availability (65%), and uncertainty in figure funding (63%) as major financial concerns. Additionally, 33.5% of respondents mentioned limits by their state on raising revenue locally as hindering their ability to finance projects.

The most common sources of financing for infrastructure are municipal capital budgets (66%), grants (65%), and municipal bonds (47%). Grant programs like the American Rescue Plan Act (ARPA) and Infrastructure Investments and Jobs Act (IIJA) were documented as helping municipalities complete overdue projects and modernize facilities.
“As state and federal governments reduce grant funding and even agency-supported projects, local governments are going to be asked to shoulder more of the responsibility,” Morrell said. “This will require more creative partnerships and increased use of debt to fund necessary projects. JP Morgan is forecasting that local budget pressure and federal budget cuts will drive up municipal bond issuance by 10 to 15%.”
The survey found there is $4.2 trillion in outstanding municipal bonds and loans nationwide, with tax-exempt general obligation bonds being the most popular. Morell said the state of Tennessee allows local governments to issue bonds, notes, and enter into loan agreements to finance projects.
“Within those categories, a local government can pledge its full faith and credit (general obligation), specific revenue sources, or a combination of revenue and general obligation (double barrel),” he said. “In addition, the state and federal governments offer loan programs. These options create a robust network of financing sources for Tennessee’s local governments. More competition means lower cost for our cities and taxpayers. Since our creation in 1985, TMBF has closed 1,750 loans valued at more than $5.1 billion. We have worked with 293 different cities and counties and saved taxpayers more than $728 million in interest expense alone. We are grateful for all that our committed public officials do every day to make Tennessee a better place.”
However, if the tax-exempt status of these bonds were removed, municipalities would face significantly higher borrowing costs, potentially delaying or reducing the scope of infrastructure projects.
“If the tax-exempt status of municipal bonds is removed, then borrowing costs will be higher,” Morrell said. “For example, according to Charles Schwab, the current 10-year yield on an A-rated corporate bond is 5.15% while the current 10-year yield on an A-rated tax-exempt municipal bond is 4.42%. This implies that an A-rated municipal government’s new issue interest expense will increase by $7,300 per million dollars outstanding, per year, if they are no longer tax exempt.”

The loss of tax exemption could also lead to decreased investor demand, further increasing interest rates, and limiting access to affordable financing. Ultimately, such a policy shift could strain municipal budgets, reduce public investment, and hinder long-term economic growth, or even potentially force tax hikes.
Morrell said some Tennessee cities are already finding other, creative ways of financing projects.
“A few Middle Tennessee communities are using forms of public-private partnerships with developers paying for certain improvements like roads, sidewalks, and water and wastewater infrastructure,” he said. “In addition, cities are pursuing more grant funding and state appropriations in the face of flat fuel tax revenues and inflation outpacing revenue growth.”
Non-financial obstacles were also mentioned as top worries, including regulatory compliance and permitting issues (45%), staffing shortages and lack of skilled labor (42%), and political or bureaucratic impediments (35%).
MEASURING SUCCESS
When it comes to measuring success, officials indicated achieving specific project goals or objectives (76%), improved community quality of life (73%), and public safety outcomes (67%) were their benchmarks. Only 58% said they considered completing projects on time and within budget a measurement of success.
To ensure capital investments are maintained, 87% of officials said they relied on in-house maintenance teams while 82% said they performed maintenance only if issues were reported. Regularly scheduled inspections and maintenance are undertaken by 80% of city officials, with 59% relying on geographic information systems (GIS) to track maintenance issues and 55% relying on private contractors.
"Municipal leaders see their infrastructure as a cornerstone of sustainable economic growth, with far-reaching implications for community well-being and resilience,” the report stated. “Cities, towns, and villages must focus on setting clear priorities, overcoming barriers and implementing healthy management strategies to address their infrastructure needs effectively.”