Tennessee’s Births are Up – Now the Rest of the Story
Tennessee State Data Center
Boyd Center for Business and Economic Research
Despite a declining fertility rate, a growing female population is pushing the number of births in the state higher.
The number of childbirths was up again last year in Tennessee.
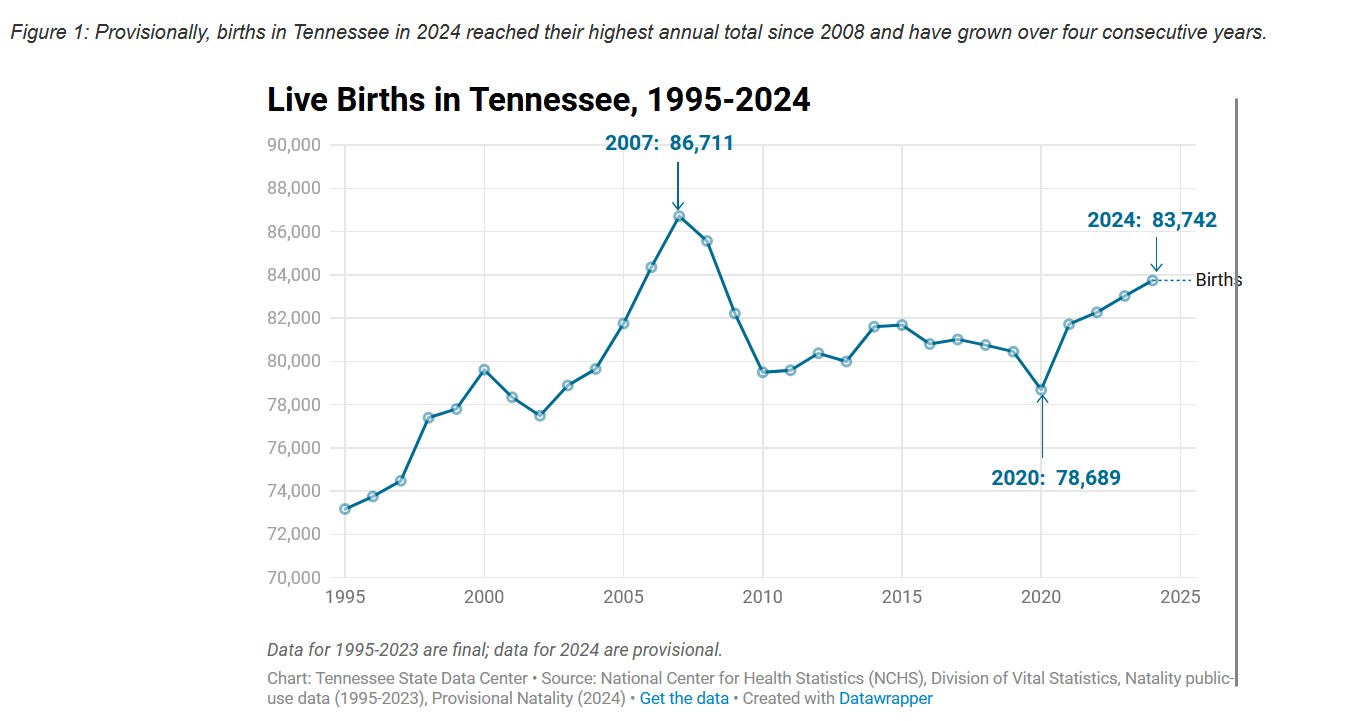
Provisional data show that there were 83,742 births in Tennessee in 2024. That makes four straight years that the number of live births to Tennessee mothers has increased, and last year births reached the highest annual level since 2008.
Those recent increases come after births fell from a record high in 2007 and then stagnated for most of the last decade. Then, in 2020, missed conceptions related to pandemic uncertainty pushed births to their lowest annual total since 2002.
What’s driving the latest uptick? In the simplest terms, two factors can account for the increase: more females of child-bearing age or an increasing fertility rate.
The population of females in their prime child-bearing years, aged 15 to 44, is rising. Since 2007, the number of females in this age group has increased by nearly 11 percent, slightly below Tennessee’s 15 percent total population gain. An increase of that size would typically result in a corresponding rise in the number of births. However, since the total number of annual births in 2023 is 4.3 percent lower than the 2007 figure, it indicates that fertility rates fell as the female population grew. (Figure 1)
State and National Fertility Rate Declines
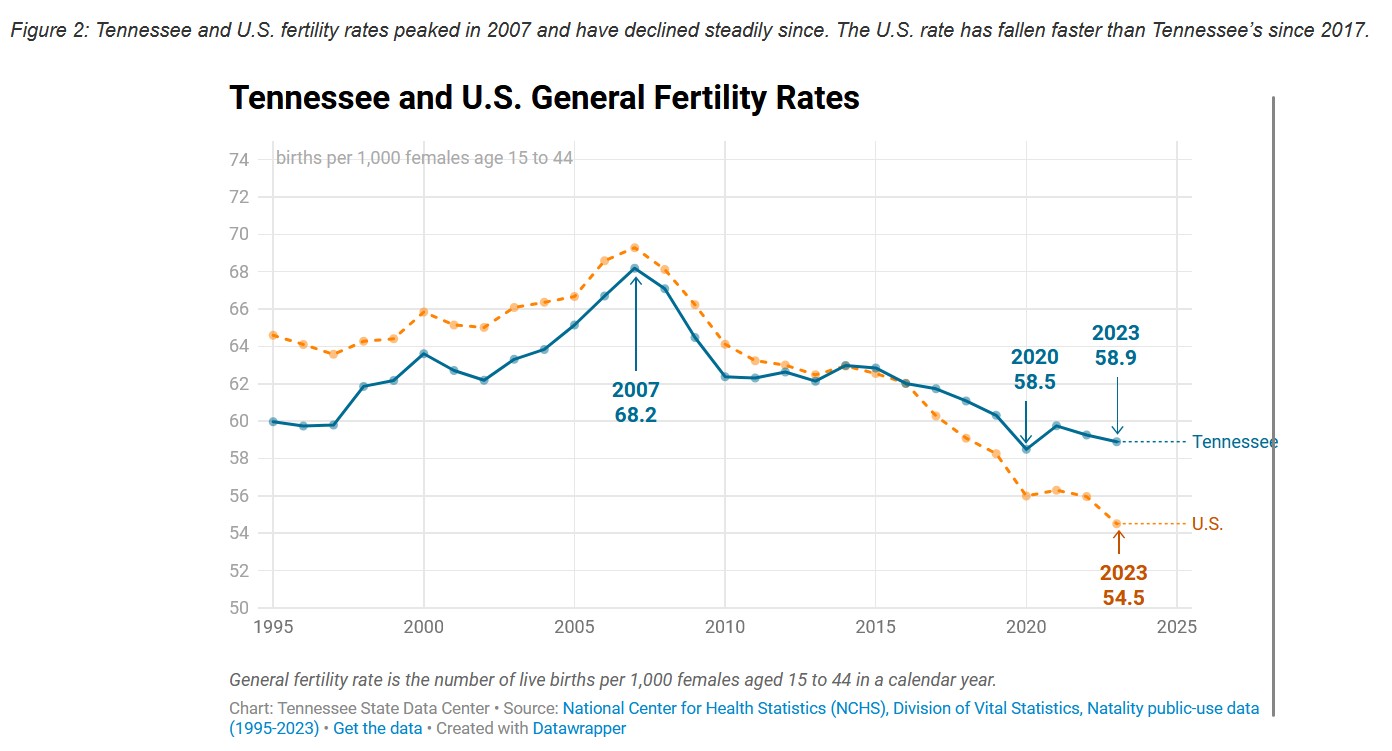
The general fertility rate is measured as the number of births per 1,000 females aged 15 to 44. In 2023, the latest year for which data is available, Tennessee’s fertility rate was 58.9. This was the 14th highest fertility rate among the states. That level is down from its recent high in 2007 when Tennessee’s rate topped out at 68.2 and the state was ranked just 29th (Table 1). That decline is noteworthy and explains why the number of births stagnated through the 2010s even with a growing population.
But it also points to the fact that Tennessee’s fertility rates haven’t fallen as sharply as the nation as a whole. The U.S. fertility rate now sits at a historically low level of 54.5 (Figure 2). Like Tennessee, the nation experienced a notable increase in the fertility rate in 2007, reaching 69.3. This stands out as a recent high but doesn’t approach rates seen prior to the 20th century and during the 1946-1964 “Baby Boom.” The mid-1950s, the most prolific period of this era, produced fertility rates that were more than twice current levels, peaking at 123 births per 1,000 women ages 15-44 in 1957.
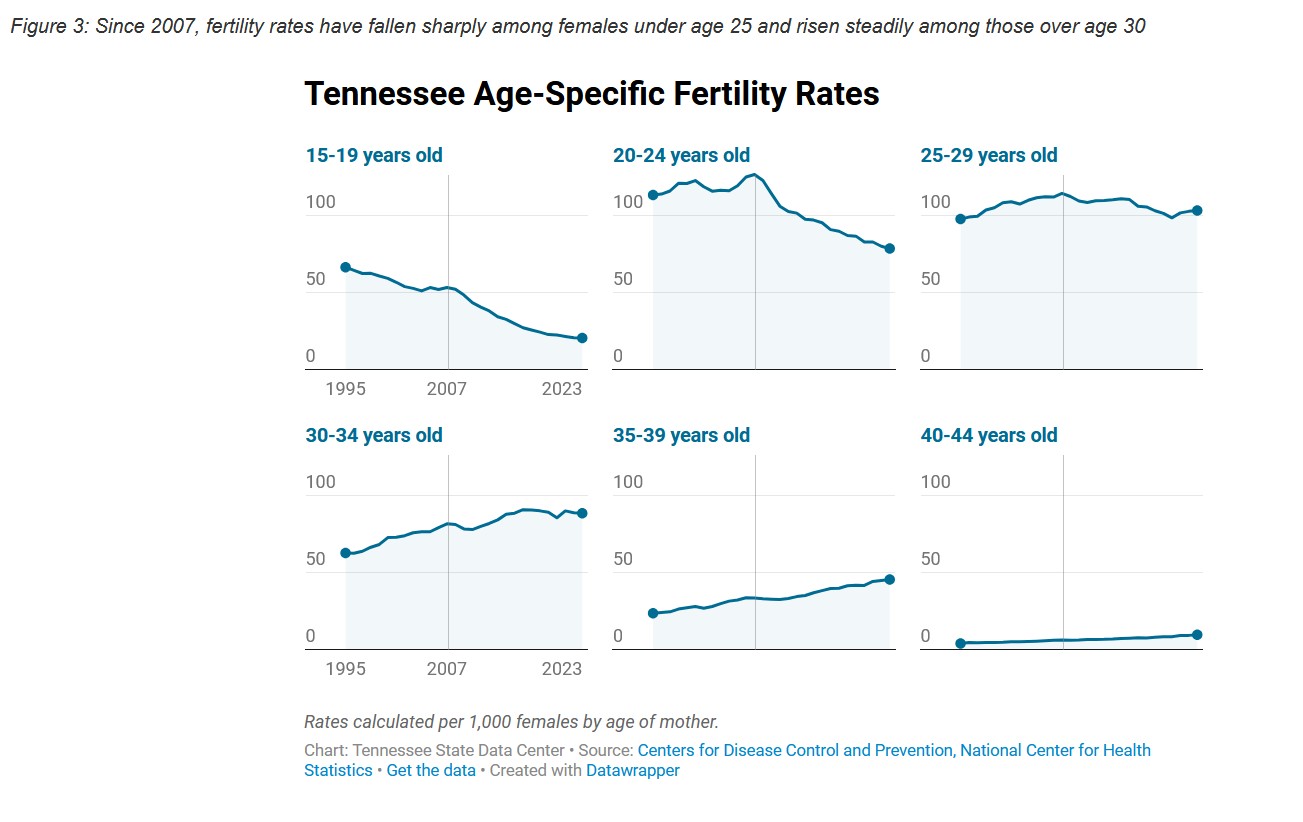
The state’s recent declines are strongly associated with two age-specific trends: falling fertility rates among younger women and rising fertility among older ones. Fertility rates among mothers under the age of 29 have fallen for all age groups since 2007. The most pronounced decrease has been among teens, with fertility rates down almost 60 percent over that period and an additional 10 percent going back to 1995. Among 20- to 24-year-old females, there was a 38 percent drop since 2007. But perhaps the most striking statistic is that in 2023, a female aged 30 to 34 years now has a higher fertility rate than a female aged 20 to 24 years, traditionally considered the peak reproductive age group (Figure 3).
In contrast, fertility rates have risen in all groups over the age of 30 since the state’s recent high in 2007. The 30-to 34-year-old group has the highest fertility rate at 88.6 births per 1,000 females, but the largest jump since 2007 was among the 35-to 39-year-old group. It rose from 33 to 44.5 in 2023. Importantly, the fertility pickup among women aged 30 and over has not been large enough to offset the declines seen among females 29 years and younger, which underlies the state’s sustained fertility rate decrease.
The decline in fertility rates among younger females and the increasing rate among older ones can be succinctly summarized by looking at the share of mothers whose first child was born after age 30. In 2007, 17 percent of mothers were over 30 years old when their first childbirth occurred. By 2023, it had grown to over 28 percent. Parenting later in life can present health or fertility challenges but also career and childcare impacts. On the one hand, being more established in a career can create more family stability, but it can also mean more struggles in balancing the demands of work and parenting.
Changing Fertility Patterns Across Tennessee
Since 2007, Tennessee has seen widespread fertility rate declines that have touched every corner of the state. Both urban and rural areas are down. Rates have dropped in all 10 metropolitan areas and all 17 smaller micropolitan statistical areas. 79 out of 95 counties also have lower reported rates.
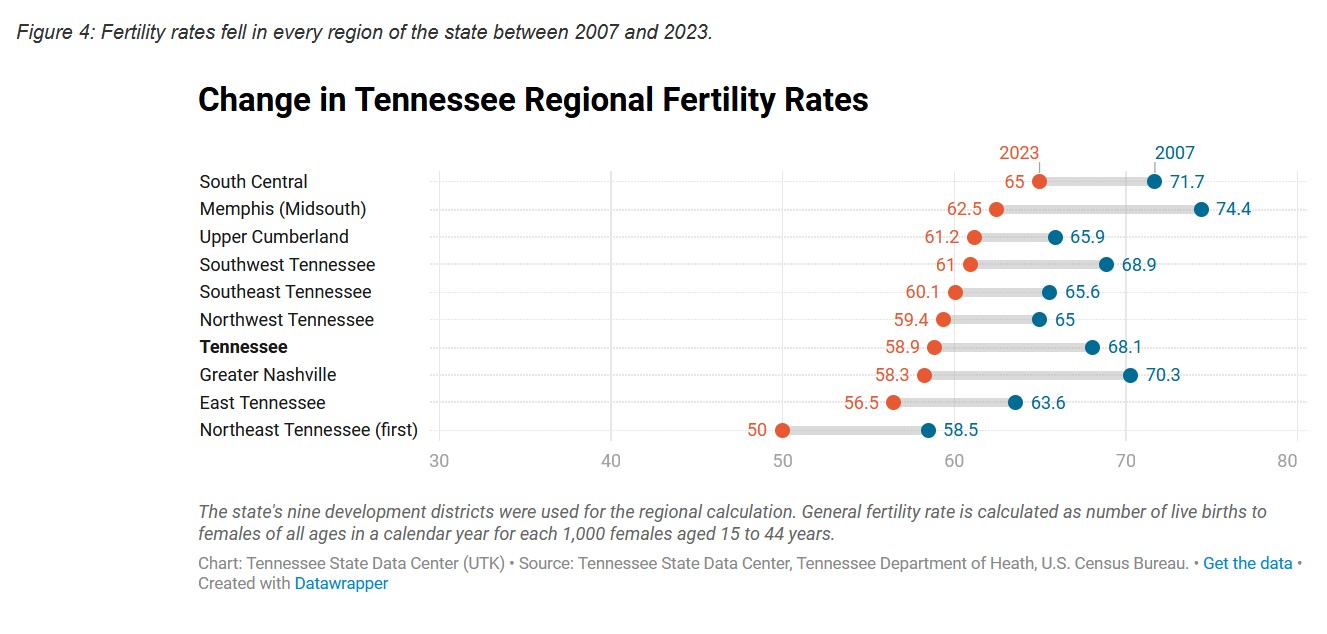
Fertility rates have also contracted in every region of the state between 2007 and 2023. We used the state’s nine development districts to analyze regional patterns of fertility change and found that the regions containing the state’s largest population centers were down the most. The Greater Nashville and Memphis regions both saw 12-point declines, the largest over the period. Five other regions, including South Central, Upper Cumberland, Southwest, Southeast and Northwest, all saw smaller 5.5-to 8-point declines that left them higher than the state’s 2020 rate of 58.9 births per 1,000 females of childbearing age (Figure 4).
Two other regions in the eastern third of the state (East and Northeast) joined the Nashville region in having fertility rates below the state level in 2023. In the East Tennessee region, fertility rates are somewhat suppressed due to a large population of college-age females. This factor is also present to some extent in Northeast Tennessee, but in that region, all eight counties have fertility rates under the state average.
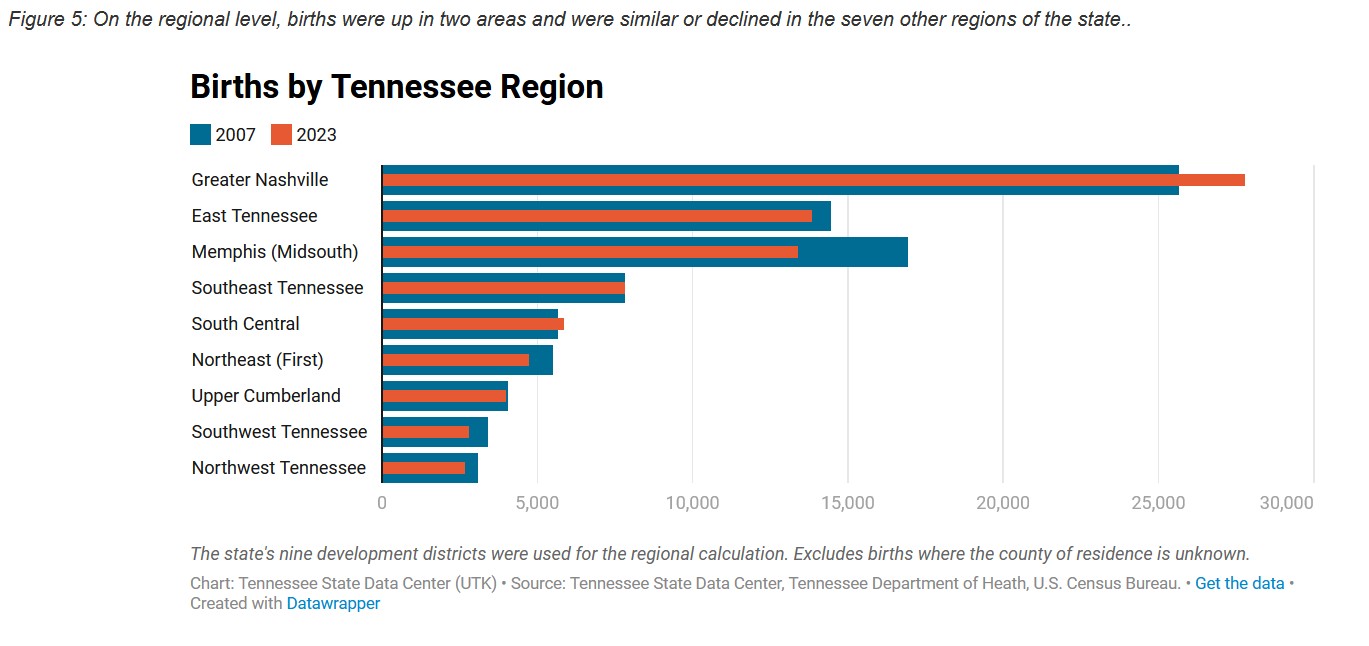
These regional shifts have had varying effects on births between 2007 and 2023. The number of births in two regions of the state rose despite the across-the-board fertility rate decline. Greater Nashville (+2,126) and South Central (+190) both had a growing number of births that were a function of rising population. Many of those increases came in fast-growing counties in the heart of middle Tennessee like Rutherford, Wilson, Montgomery, Maury and Sumner counties. That trend also
A stagnant or declining number of births was recorded in seven other regions of the state. The largest drops occurred in the Memphis region. There, the number of births was off 20 percent (-3,521) as the combined effects of both falling population and fertility were felt (Figure 5).
Long-term Implications for Tennessee’s Population
If the number of births in the state is to continue rising against the grain of a falling fertility rate, it will require sustained growth of the state’s population of child-bearing age women.
So far in the 2020s, that hasn’t been an issue. The state logged its second largest year over year population increase in 2022 with more than 96,000 people added on record-levels of net domestic migration. Increases of 86,000 and nearly 80,000 followed in 2023 and 2024 as international migration pushed to single-year highs. But migrant flows from international locations are almost certain to slow and the cyclical pattern of domestic migration may have passed its peak. That makes it less clear what birth and migration patterns might look like through the end of the decade and beyond.
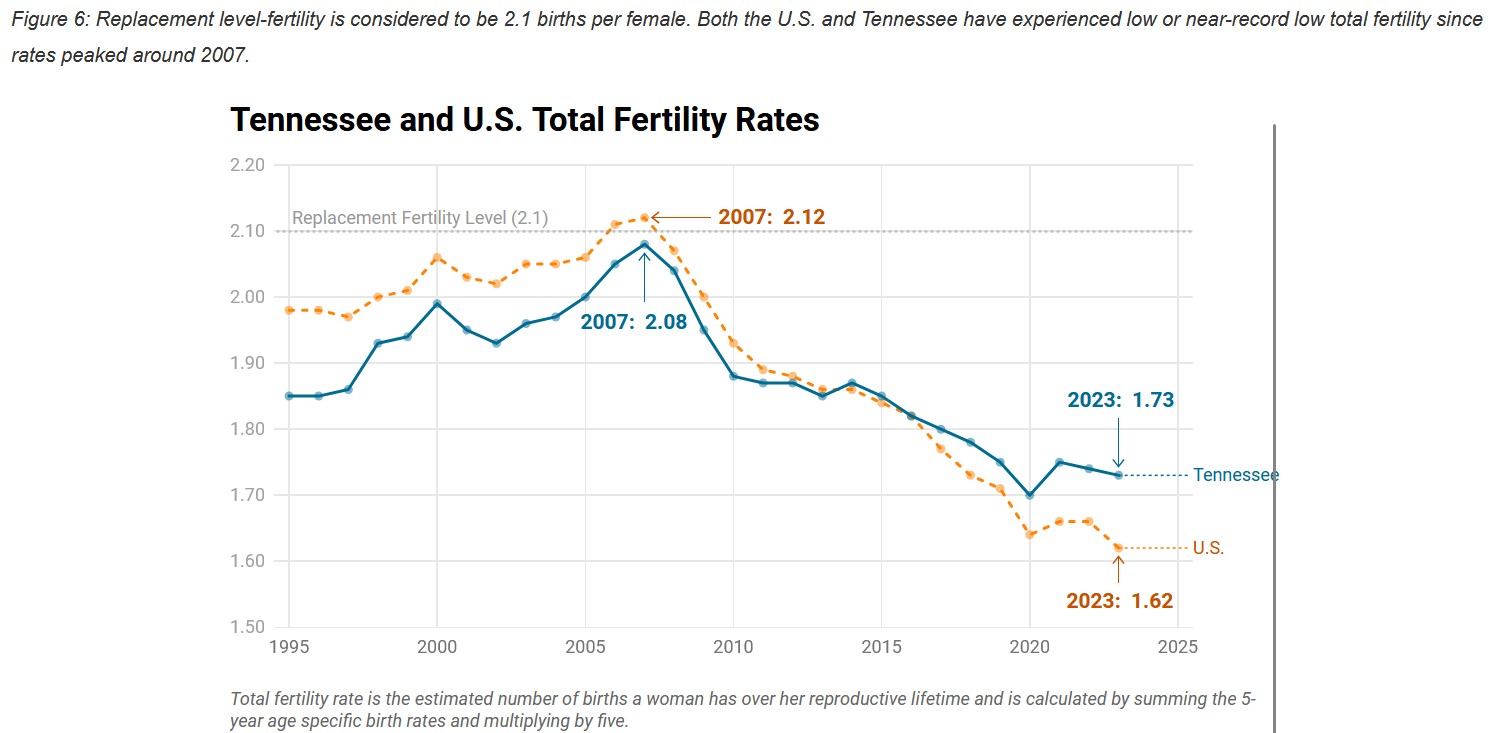
Over the longer-term, it is certain that reproductive rates are below “replacement level” – the level at which population can replace itself from generation to generation. An average total fertility rate (TFR) of 2.1 children per female in her childbearing years is necessary to maintain a stable population size without relying on migration. After total fertility peaked at around 2.1 in 2007, it’s been a steady slide. In 2023, the U.S. TFR fell to a record low 1.62 births per female. Tennessee’s TFR was slightly higher at 1.73 births (Figure 6).
The interplay of falling fertility rates and population change will lead to further shifts in birth patterns at both county and regional levels. Since births, along with deaths and migration, are the primary drivers of population changes, these shifts will significantly influence local trends modeled in population projections. Understanding these dynamics is crucial for planning and policymaking to address future demand for educational services, the labor force, healthcare, housing, and infrastructure.
